Federal Reserve Economic Fundamentals: High School Curriculum
Introduce basic economic concepts with ten independent hands-on lesson plans.
{{searchResultSnippet}}
 0-15 min

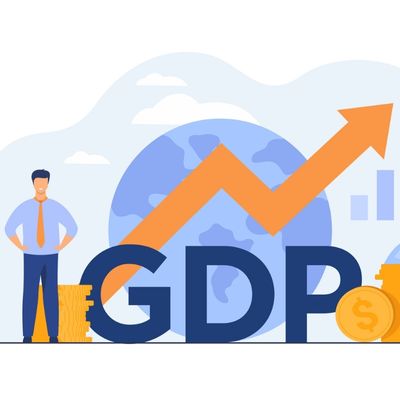
This video assignment explains the difference between real and nominal GDP. Using an example from a pizzeria, the video explains why it’s important to adjust GDP for inflation when examining GDP over time.
Because GDP is a measure of the size of the economy, it can be useful for discussing how the economy is performing over time. If the economy at one point in time is $20 Trillion, and $22 Trillion at a later point in time, a simple calculation tells you that GDP, also known as nominal GDP, increased by 10 percent. With this information, you might assume that the economy grew by 10 percent – meaning you might assume production of goods and services increased by 10 percent.
However, there’s a pretty good chance that prices changed over that time span. So, some of that 10 percent growth, might be a change the prices of goods and services; meaning not all of the 10 percent increase in GDP represents an increase in the production of goods and services.
Let’s use pizzas as an example again. Imagine these data reflected the income generated from your pizza parlor.
Year 1 you sold $500,000 worth of pizza.
Year 2 you sold $900,000 worth of pizza.
That’s a 80% increase – but does that really mean that the pizzeria produced 80 percent more pizzas this year than last year? Not necessarily. Here’s why – it is likely that both the prices and quantities increased from year 1 to year 2.
Let’s assume in year one the pizzeria produced 50,000 pizzas and charged $10 per pizza.
50,000 x $10 = $500,000
Then in year 2, it sold
60,000 x $15 = $900,000
Notice that income is calculated by multiplying the price of the goods by the quantity produced. In this case, the increase in income is the result of both an increase in price, and an increase in output.
In other words, because part of the increase in income from year 1 to year 2 was due to rising prices, you need to account for changing prices to discover how much of the increase in GDP was due to higher output.
If we want to know about the change in output, we must hold the price constant.
In this case, let’s hold price constant at $10—the price of pizza in Year 1. So, let’s multiply the year 2 quantity by the year 1 price.
Year 1
50,000 x $10 = $500,000
Year 2
60,000 x $10 = $600,000
Once we hold prices constant, we can see that in real terms, output increased by 20%, not 80%.
So, in economics “real” means that we have adjusted for inflation and measured in constant prices—that is, in prices of a given or base period.
This is true for pizzerias, but also true for the economy at large. When examining GPD over time it’s important to use Real GDP, which is GDP that has been adjusted for inflation.

Federal Reserve Economic Fundamentals: High School Curriculum
Introduce basic economic concepts with ten independent hands-on lesson plans.
 16-30 MIN
GDP: Measurement and Growth
Explore the measurement and growth of GDP.

Gross Domestic Product
Visualize the components of Gross Domestic Product (GDP).
 0-15 MIN
10 FRED Graph Activities in 10 Minutes
Learn about data through graphing activities.
 0-15 MIN
Gross Domestic Product
Learn what GDP measures, how it is calculated, and how it can be used.
 16-30 MIN
How Do Imports Affect GDP?
Learn how imports are calculated in GDP.
 0-15 MIN
Definition of GDP
Provide a definition of GDP, what it measures, and how it is calculated.
0-15 MIN
The Components of GDP
Explore the expenditure approach that textbooks use to explain GDP.
0-15 MIN
Measuring Exports and Imports in GDP
Look at how imports and exports are counted in GDP.
0-15 MIN
Per Capita GDP
Provide students with an easy-to-understand definition of per capita GDP.
0-15 MIN
Levels of GDP vs. Percentage Change in GDP
Explain why economists prefer to discuss changes in GDP through percentages.
0-15 MIN
Trend Growth
Explain potential output and why the economy might experience output gaps.
0-15 MIN
Automatic Stabilizers
Explain automatic stabilizers and how they help smooth the business cycle.
{{resourceDuration}}
{{resourceTitle}}
{{resourceBlurb}}
